In this project we create a PowerBI dashboard to ensure smooth operation for supply chain department.
Table of contents
- 00. Project Overview
- 01. Design Thinking
- 02. Data Visualization
- 03. Insights & Detail Analysis
- 04. Discussion
Project Overview
Context
The Purchasing team will be responsible for procuring goods, raw materials, and semi-finished products to support production. The leadership expects that goods are ordered in sufficient quantities for sales, on time, and at optimized costs.
Business Question
Create an overview dashboard for stakeholders that displays the fulfillment rate & COGS (cost of goods sold) of products and helps identify which product or category needs further review.
Develop solutions to improve the situation and optimize costs.
Design Thinking
There are 5 steps of design thinking:
Step 1: Empathize

Step 2: Define

Step 3: Ideate

Step 4 & 5: Prototype & Review

Data Visualization
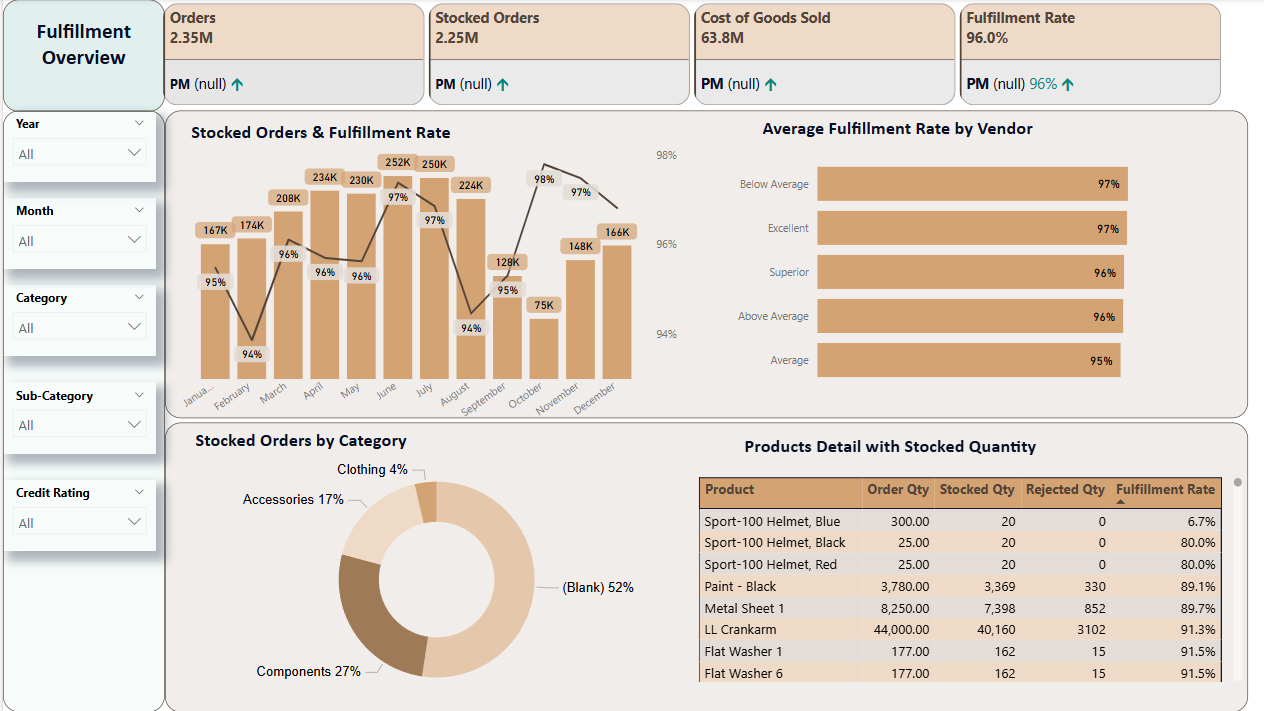
1. Fulfillment Overview

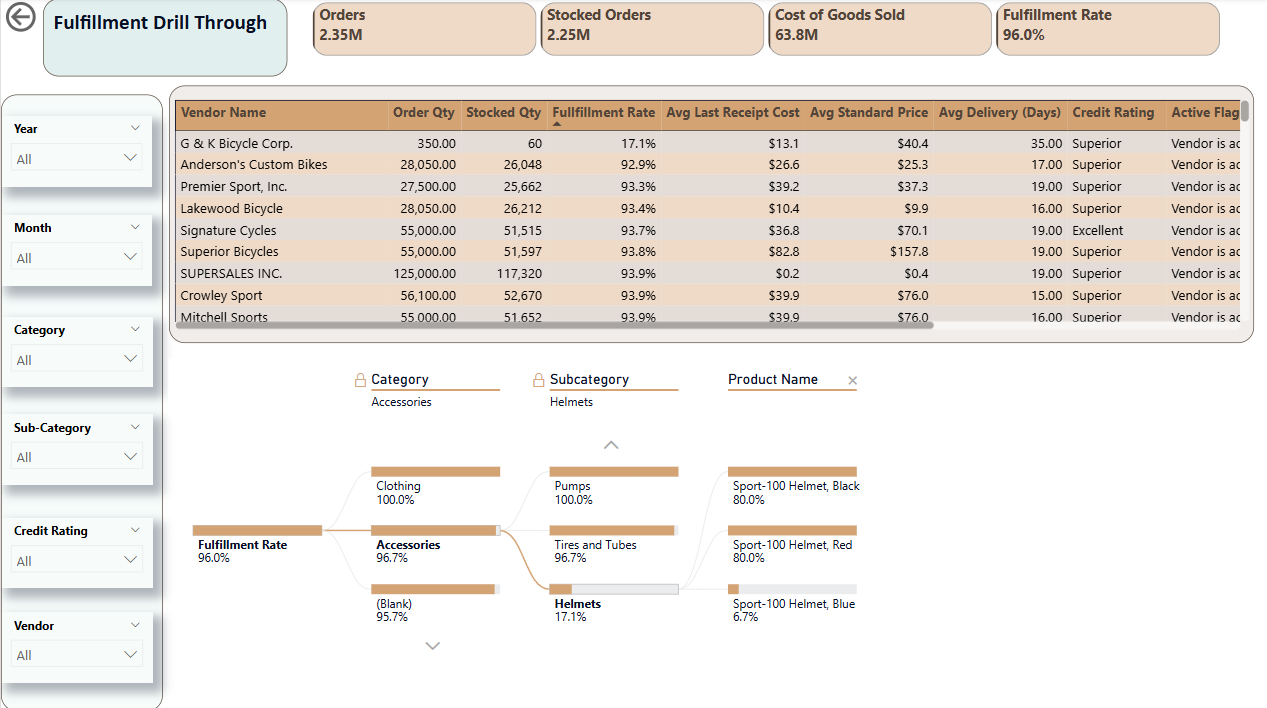
2. Fulfillment Drillthrough

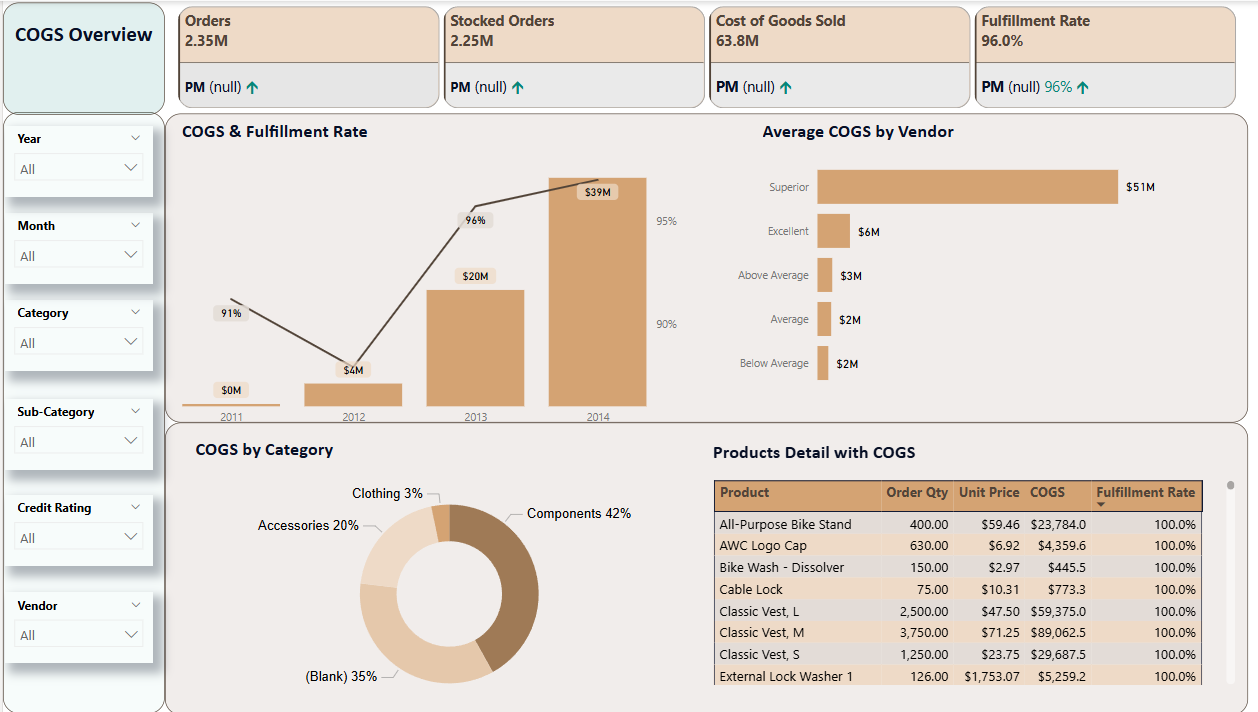
3. COGS Overview

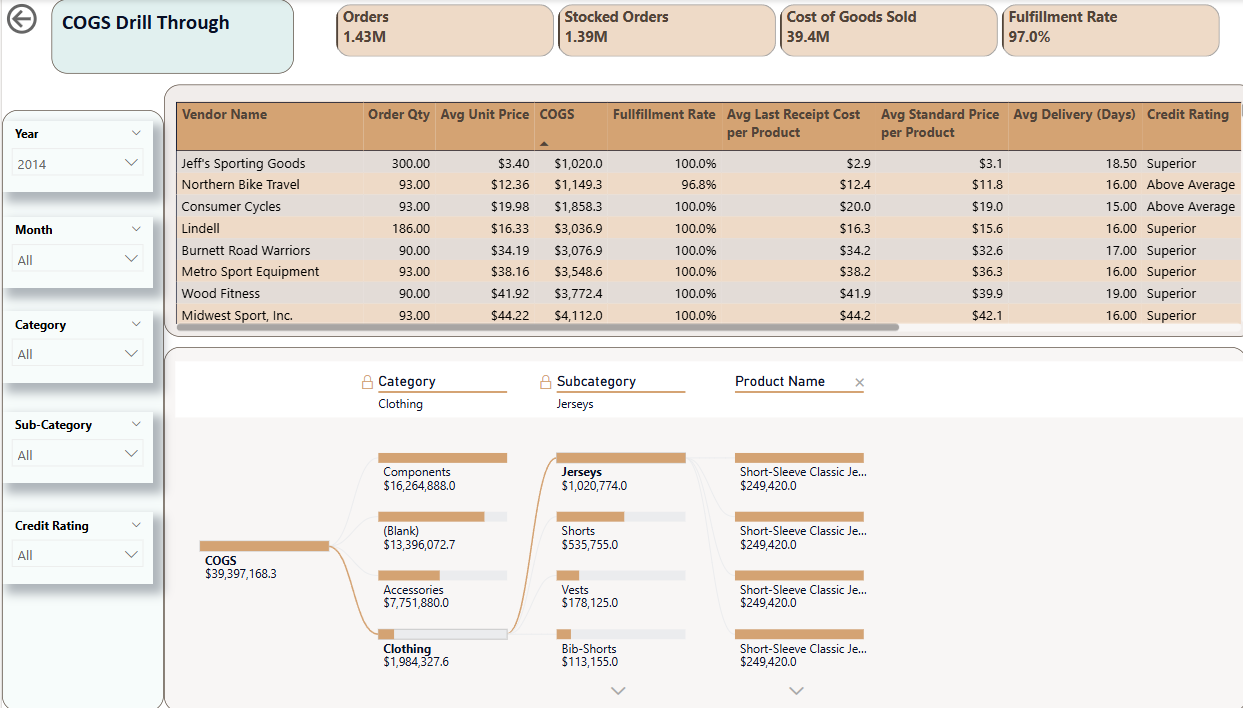
4. COGS Drillthrough

Insights & Detail Analysis
Discussion
Overall, the company performed notably well over the year. However, there are a few things our company should escalate in the future:
- Substitute vendors with Fulfillment rate > 95%.
- Limit sourcing from Mitchell Sports & First Rate Bicycle vendor since Fulfillment rate <75%.
- Needs to pay attention to Helmet Product with a very low Fulfillment rate as well as delivery day (takes longer than 35 days).
- Continue developing strategy for Clothing Category (rapid increase from 2013 to 2014).
- Optimize unit price for each product from vendors that have the same Fulfillment rate & Vendor Rating.